Price Index shows how your prices compare with each shop over time. Use it to track how a shop's price index changes week by week.
Open it from Historical Data in the left sidebar, then click the Price Index tab.
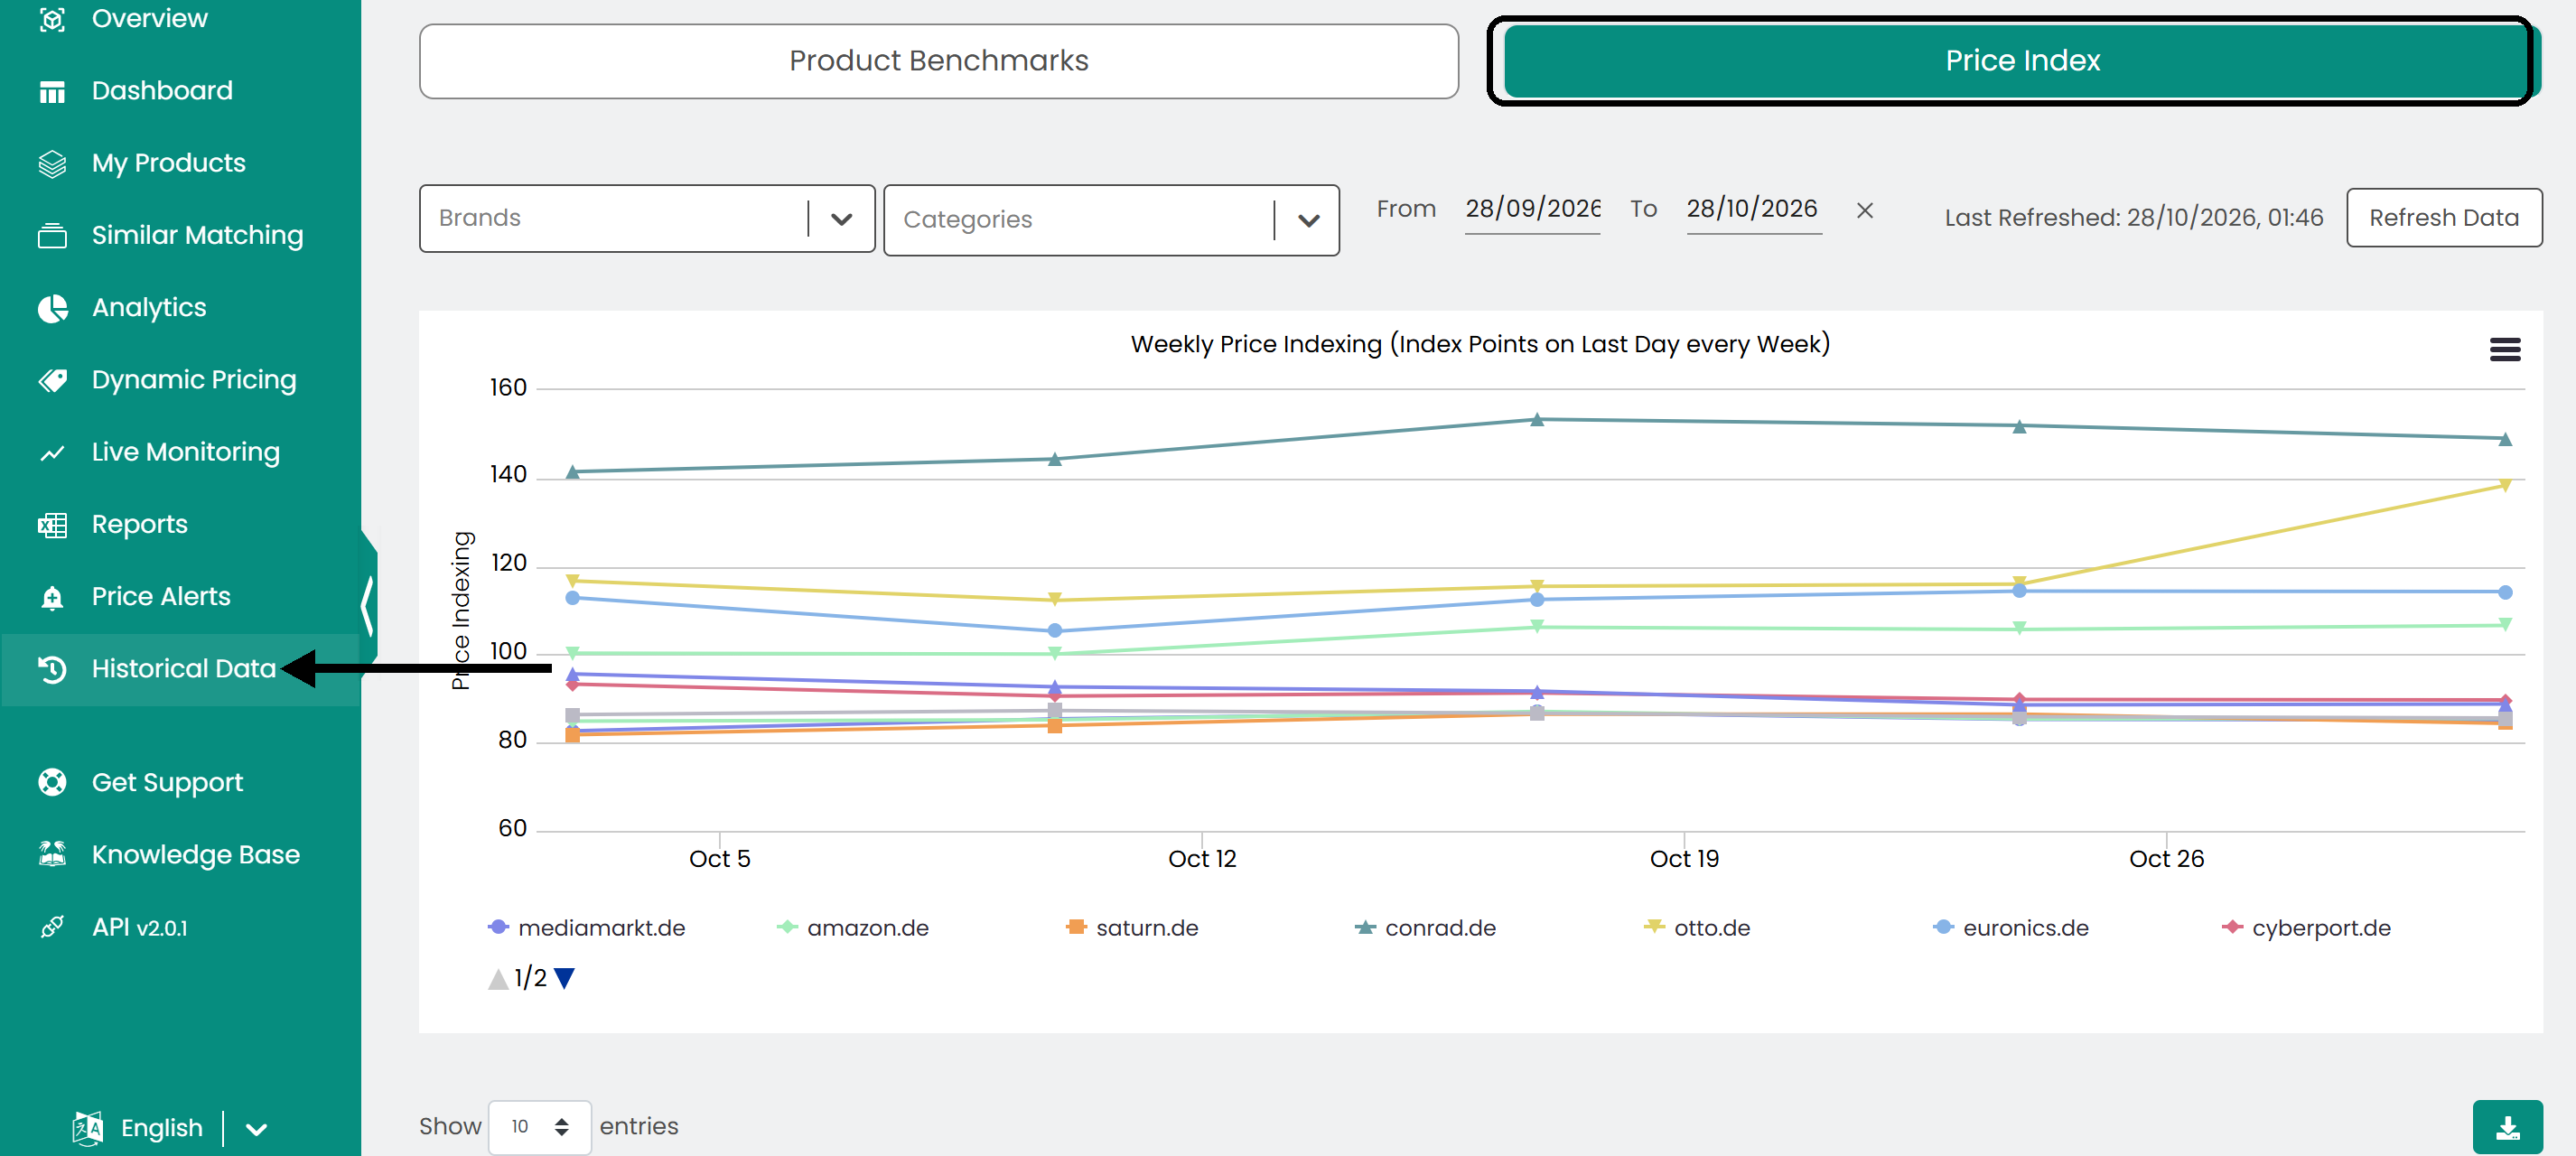
Read the graph and table
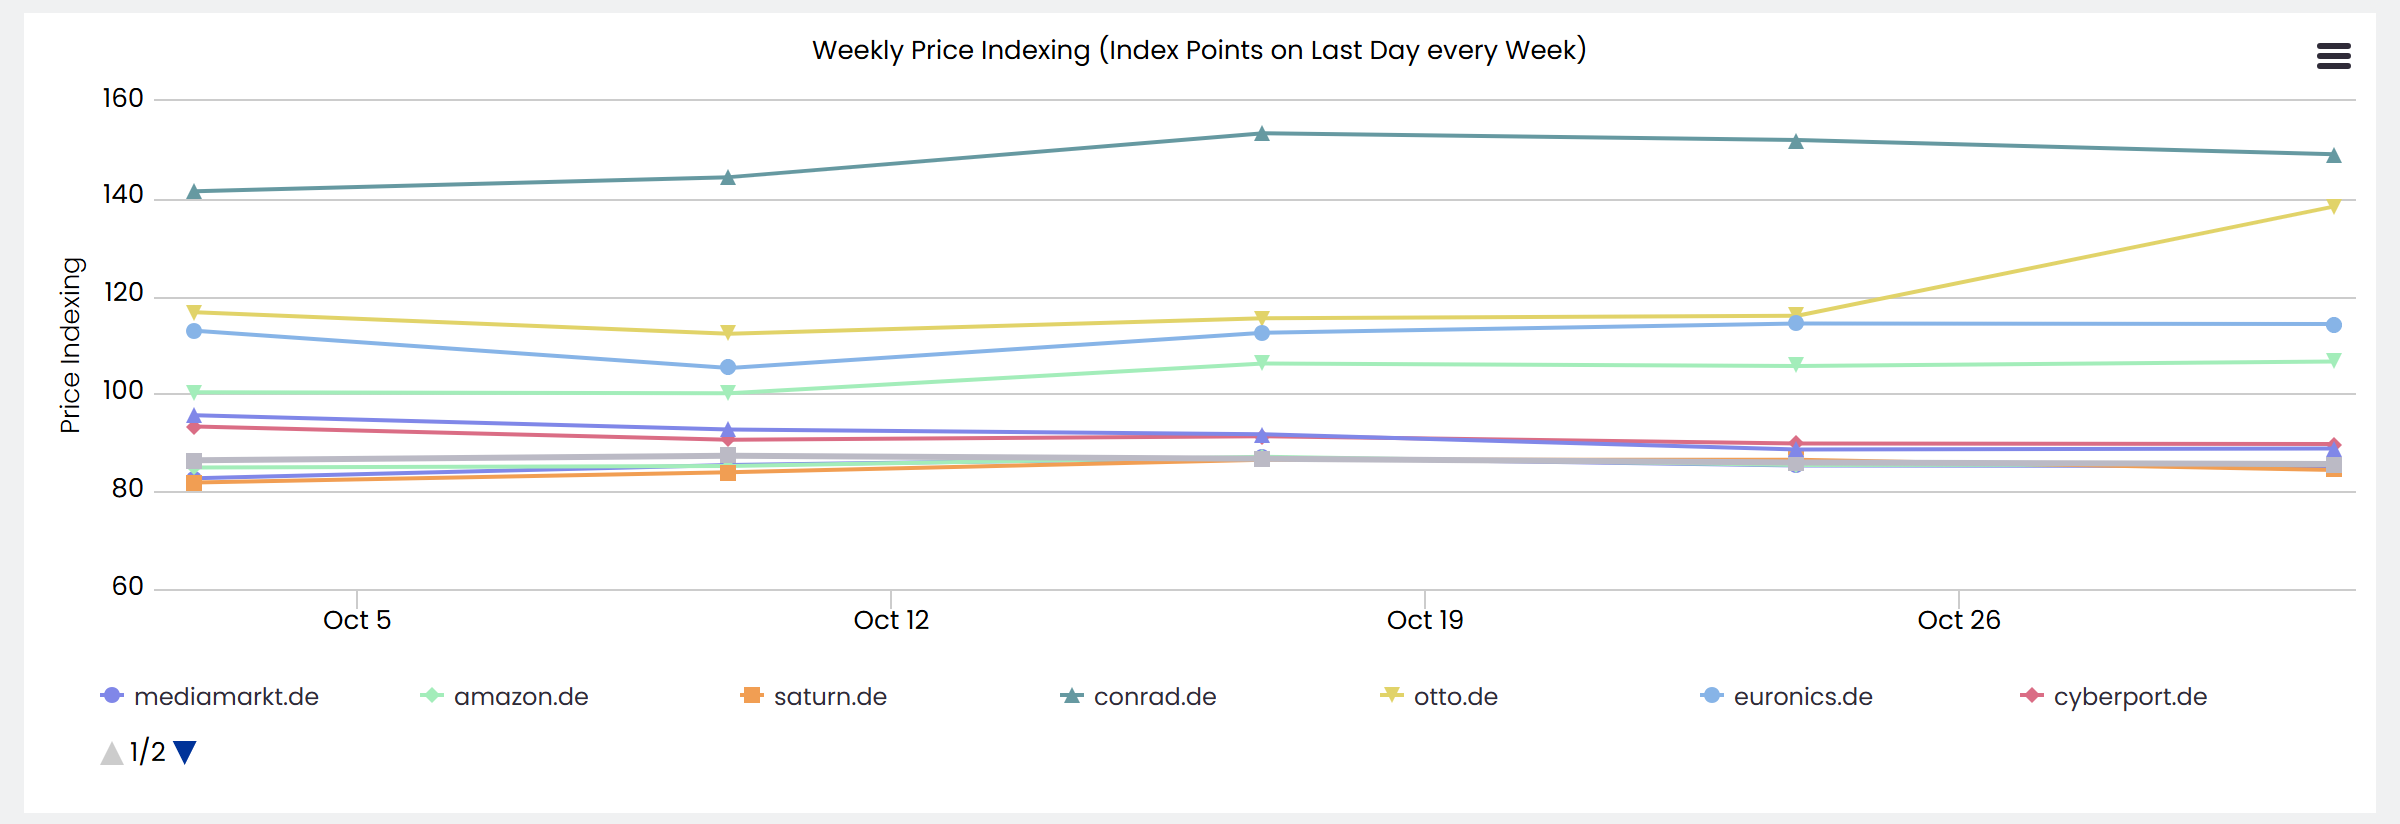
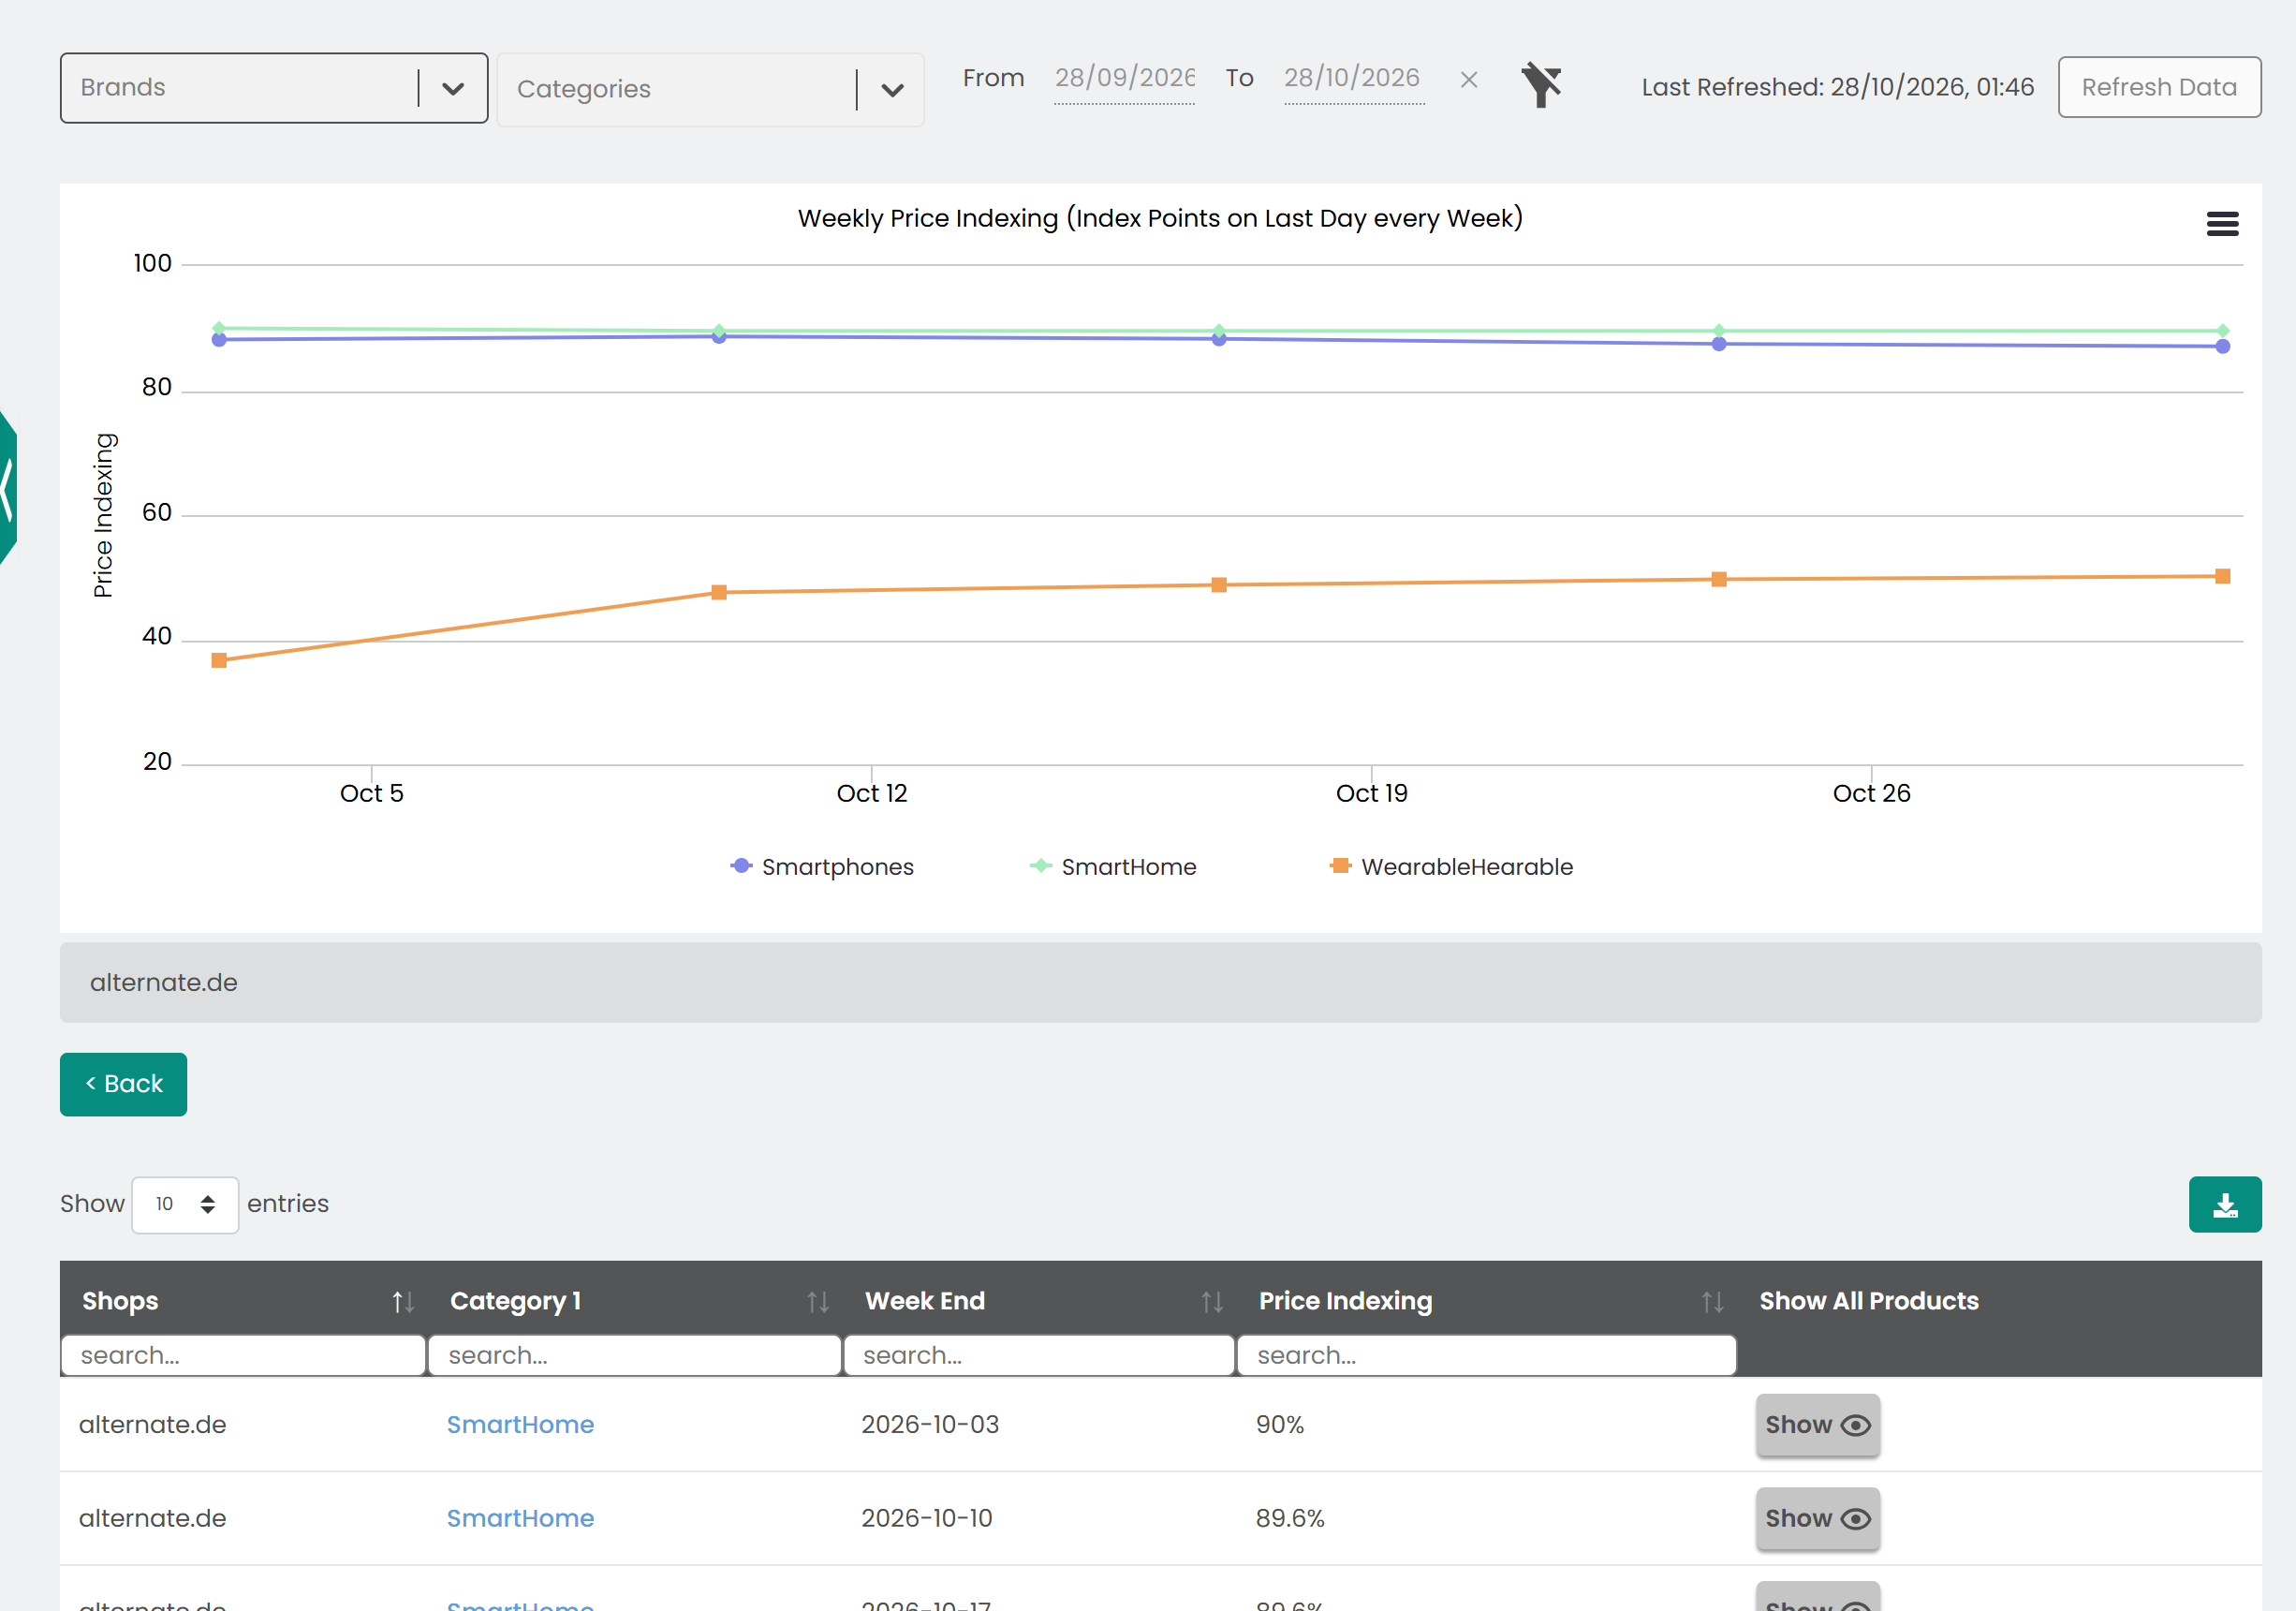
- Graph: A line chart of the price index of products across the top 10 shops (by number of matched products) over the date range you select.
- Table: A week-by-week record of the price index, with the columns Week End (the last day of the week), Shops and Price Indexing.
Note: Price Indexing is the shop's prices as a percentage of your prices on the products you both sell. 100 means the shop is priced the same as you. Above 100 the shop is more expensive than you, and below 100 it is cheaper.
Filter the data
Hover over any point on the graph to see the price index at that moment for the selected shop.
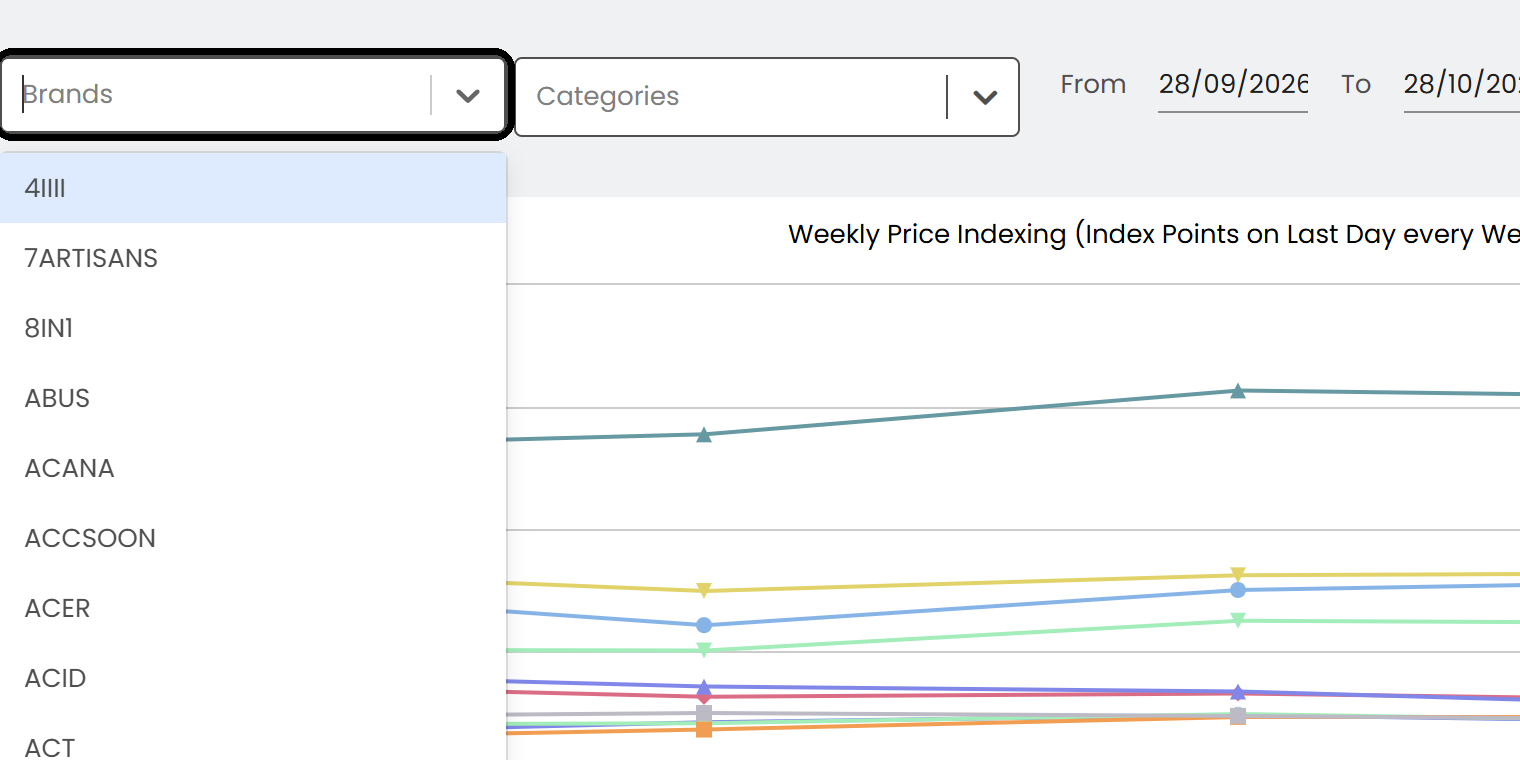
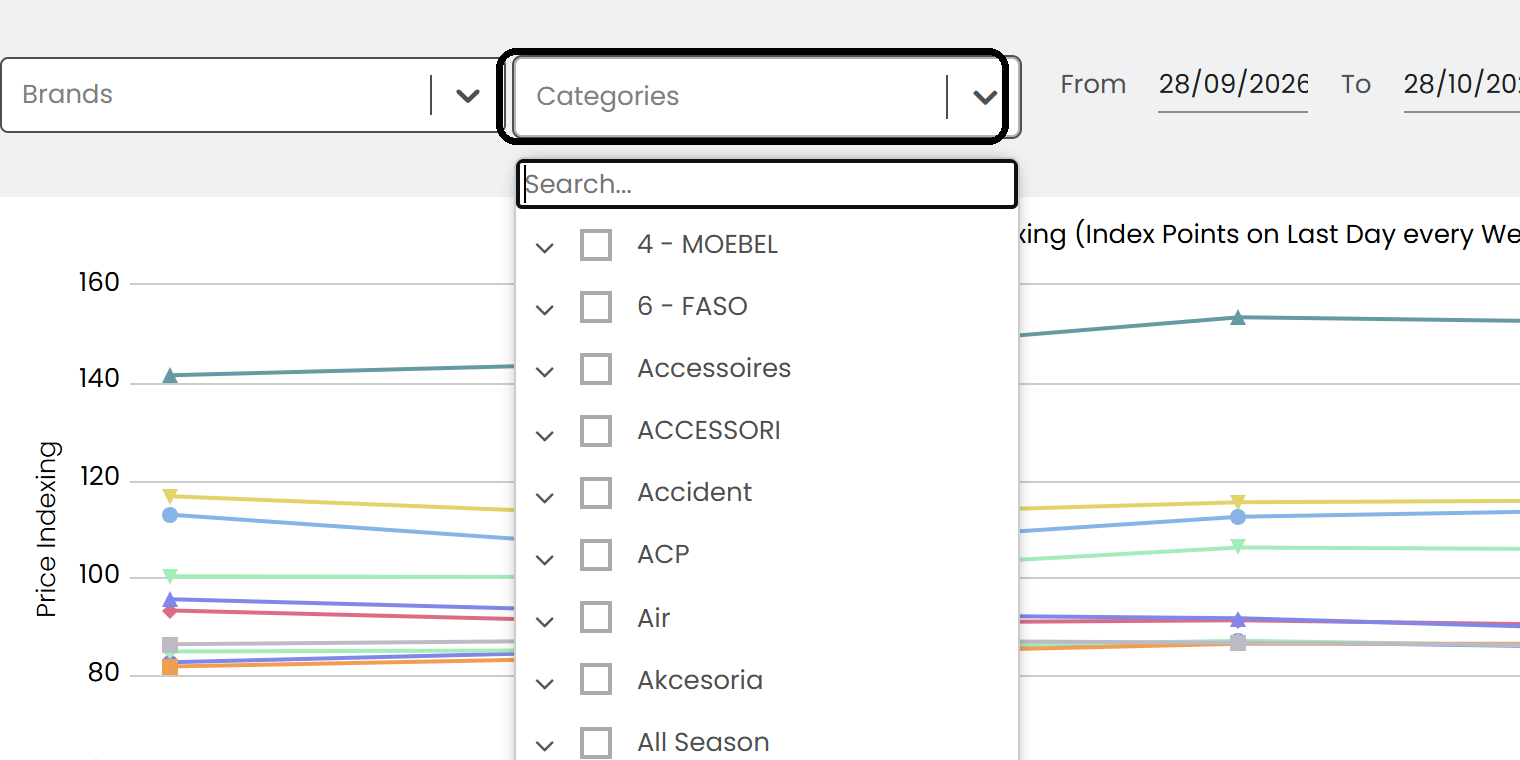
Select or deselect brands or categories to customize the view.
Select the period with the date picker.
Note: The default period is the last 30 days. You can choose up to 90 days at a time.
Explore the details
In the table, click a column header to sort. Type in the box under a header to filter the rows.


Use the Show entries list to change how many rows are shown.

Click a shop or week to see all the data for that week. From there, click a category name to go down to the product names.
Export the data
To use the data elsewhere, click the download button above the table to save it as a CSV file.

Was this article helpful?
That’s Great!
Thank you for your feedback
Sorry! We couldn't be helpful
Thank you for your feedback
Feedback sent
We appreciate your effort and will try to fix the article